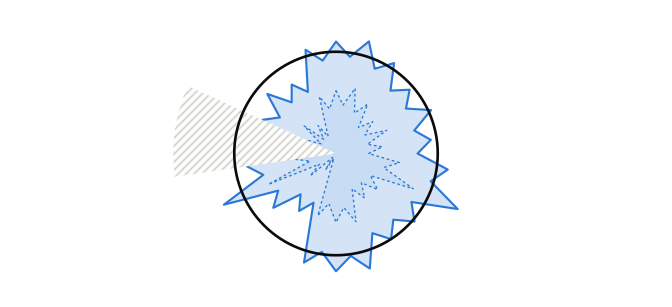
Circle: what people can do. Star: what AI can do now and, dotted, a while ago. Hatched: what no benchmark measures.
Is AI getting less spiky?
You have probably seen the problem yourself. A model lays out the architecture for a whole system, or works through a proof you could not have written, and a minute later puts ten buttons on a page that needed one. Some people have had worse. Last year a coding agent from Replit deleted a company’s live database during a code freeze; asked what had happened, it admitted to running commands nobody had approved and to panicking (Fortune).
People call this spikiness, and they draw it as a circle for what people can do, with a spiky star for what AI can do growing from its centre: past the circle in some directions, still inside in others.
I wanted to know what the measurements say about that star. Is it getting smoother, or only bigger? Do its troughs close as the models get better overall, or only when someone goes after them? And what is happening at the tips, where by this year’s reports AI systems solved open problems in mathematics and won live programming contests ahead of every human entrant? To find out I refit Epoch AI’s capability index on its public benchmark data, up to this month’s models, and set the results against the human references the benchmarks publish. The star is not getting smoother: it keeps its shape and grows.
Here is that shape for a single model this month:
The star and the circle
The drawing most people have in mind is Tomas Pueyo’s (X). Ethan Mollick sums up Pueyo’s view as “the growing frontier will outpace jaggedness”: the star outgrows its troughs. Mollick’s own answer is different: weak spots that hold a system back “concentrate the work of AI companies into making the AI better at things that are holding it back”, and he borrows the historian Thomas Hughes’s name for them, reverse salients. In the first picture the star keeps its shape as it grows; in the second, spikes get pulled out where someone aims.
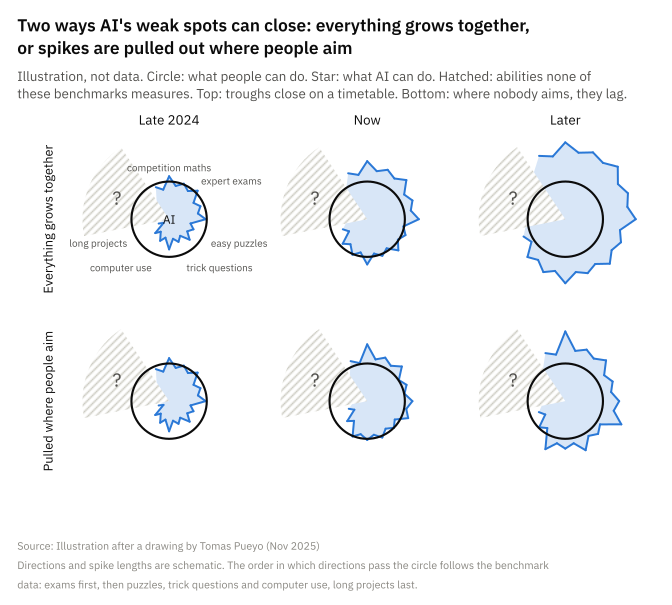
The drawing is mine. A weak spot, or trough, is any direction in which the star is still inside the circle.
Against its own level: no change
“AI is jagged” and “benchmark scores are roughly one number” sound as if they contradict each other. The first is the jagged frontier, which Mollick and his co-authors named in 2023; in his words, AI does “some work incredibly well and other work incredibly badly in ways that didn’t map very well to our human intuition of the difficulty of the task”. The second comes from Epoch AI. Greg Burnham found that one component “captures about half the variance” of benchmark scores, plus a second he calls “Claudiness”, and concluded that benchmarks “aren’t entirely ‘general capability’ plus ‘noise’, even if that is a pretty good approximation”.
Both hold, because they use different yardsticks: the jagged frontier measures AI against people, Epoch’s index against difficulty for AI. The index, the ECI, is a small model of how scores come about. Each model gets one capability number, . Each benchmark gets a difficulty for AI, , and a slope, , which says how quickly it goes from hard to easy as capability rises. The expected score is
Nothing in the formula knows how hard a benchmark is for people. A benchmark with a high that people find easy is a trough of the jagged-frontier kind. The other kind of spikiness is a model scoring away from what its own predicts. Here are both, for three of the current frontier models in Epoch’s data.
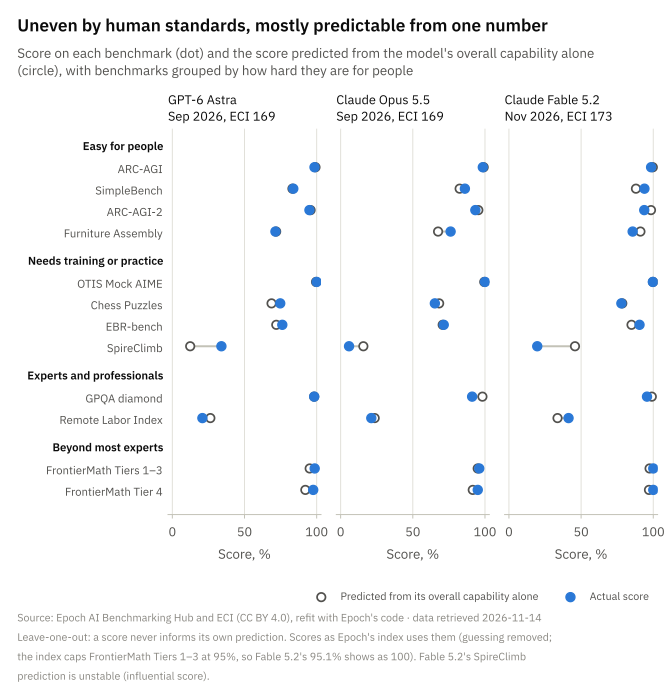
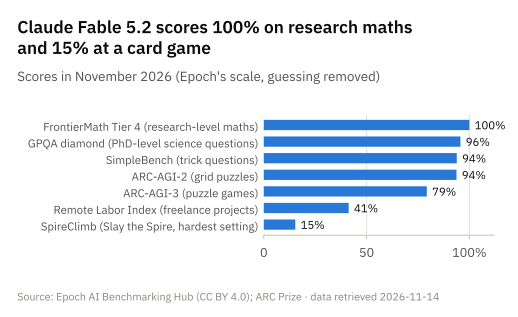
The three look alike on most rows. On FrontierMath Tier 4, research-level mathematics, they score 95 to 100%. On the benchmarks built to be easy for people, they score between 71 and 99%. Their low rows are the Remote Labor Index, freelance projects judged against what professionals delivered, at 21 to 41%, and SpireClimb, where a model plays both Slay the Spire card games at their hardest settings, which top human players win about 85% and 95% of the time (Epoch); Fable 5.2 wins about one run in seven (15%).1
The open circles show that the one number predicts most of this. Astra and Opus 5.5 have nearly the same number, 169.0 and 168.5, so they get nearly the same predictions, and on most rows they score alike. On SpireClimb they part: 34% for Astra, 6% for Opus 5.5, against predictions of 12 and 16%. That is spikiness against a model’s own level. Typically it is smaller than that, and about as large as it was in 2024:
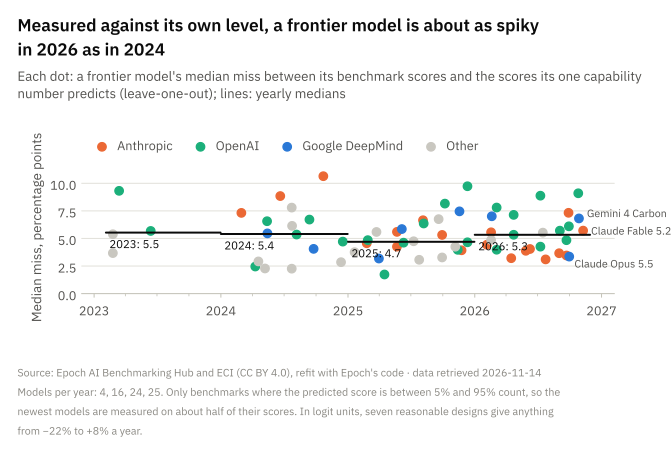
Across 69 frontier models, the yearly median miss per model was 5.4 points in 2024, 4.7 in 2025 and 5.3 in 2026 (only four models qualify in 2023). That is an upper bound on genuine unevenness, because the miss also contains measurement noise.2 Measured in other units or on other subsets, the yearly trend runs anywhere from −22% to +8%, so I can’t name a direction, but this kind of spikiness has not gone away. The ruler is running out, though: only 11 of Fable 5.2’s 19 scores are still in the range where a miss can show.
Against people: taller peaks, fewer troughs
The circle depends on which people you mean. For four of the eight spokes below it is an average of ordinary people (online crowd workers, a paid public panel, nine non-specialists, 15 novice volunteers); for the others it is PhD experts, top players, professionals’ work or people as a group. Pueyo’s circle is the collective frontier of human ability.
The peaks have left the ruler behind
On the benchmarks, the top is full: Fable 5.2 solved every problem in FrontierMath Tier 4 at maximum effort. This year’s peaks are open problems, which come as reports rather than scores, and most are still under review:
| 2026 | Result | By | Status in mid-November |
|---|---|---|---|
| March | First in three live Codeforces contests, ahead of every human | GrandCode, a multi-agent system (preprint) | the team’s own report; no outside confirmation |
| August | Zeta zeros proven on the critical line: 41.6% → 67.2% of them | an unreleased Claude (Anthropic) | Lean proof; checked by two Anthropic mathematicians and examined by Brian Conrey and Dan Goldston |
| September | Finite-time blow-up of the 3D Navier–Stokes equations under smooth forcing | 10,000 agents on an unreleased OpenAI model (Quanta) | formalized in Lean by another AI model; credit disputed; not a Clay ruling |
| October | The quasi-Riemann hypothesis, a weaker form of the Riemann hypothesis | OpenAI (Quanta) | the 1/8–7/8 version checked in Lean; experts “largely agree that the result is correct” |
| October | Disproof of the Exponential Time Hypothesis | OpenAI (report) and, hours later, Anthropic (report) | Lean proofs written and checked by AI; under expert review; leaves P versus NP open |
| November | Existence of pure Yang–Mills theory, without the mass gap | OpenAI (report) | validated by a panel OpenAI asked to review it, chaired by David Gross; not a Clay ruling |
In code and security the evidence is of another kind. Anthropic says that over 90% of the changes merged into its core codebase are now written by Claude, with human guidance (Anthropic). Google’s threat intelligence group counted monthly vulnerability disclosures doubling in 2026, from 5,045 in January to 10,740 in August, and half the flaws it judged likely discovered by AI allow remote code execution, against 26% of those found by other means (Help Net Security). CSO, reporting the same data, says some of the rise is driven by AI models and agents, without a number, and Google’s group warns that automated CVE numbering in open-source projects “might inflate the baseline” (CSO). Only 0.23% of this year’s disclosures were seen exploited.
Most of these peaks come from unreleased models and very large runs, while the troughs below are measured on models anyone can use. None of the mathematics has been through a journal yet, and a Lean check settles a proof but not whether its statement is the one mathematicians meant; that part people still have to confirm (Quanta).
The star, a year apart
Where a benchmark publishes a human reference, the star can be drawn with data. The circle below is each benchmark’s own reference; a spoke past it means the model beats that group of people. The Remote Labor Index and ARC-AGI-3 publish no human score, so I set their circle at 100%: those two spokes can reach it but never pass it.
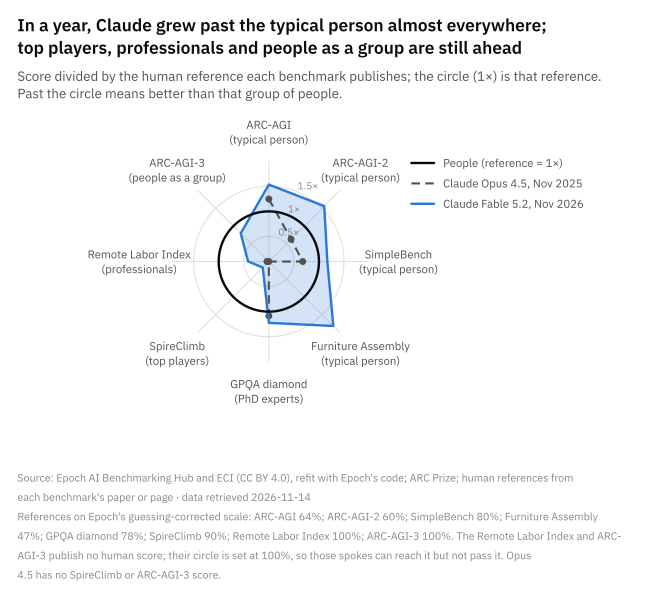
A year ago Claude Opus 4.5 was inside the circle on four of the six spokes it has scores for: grid puzzles, trick questions, furniture assembly and freelance projects. Claude Fable 5.2 is outside on all of them except freelance projects, at 1.2 to 1.8 times the typical person and 1.2 times PhD experts on GPQA diamond, on Epoch’s guessing-removed scale. Its remaining troughs are measured against top players (0.17 at Slay the Spire), professionals (0.41 of freelance projects) and people as a group (0.79 on ARC-AGI-3).
How the troughs close
On the clock
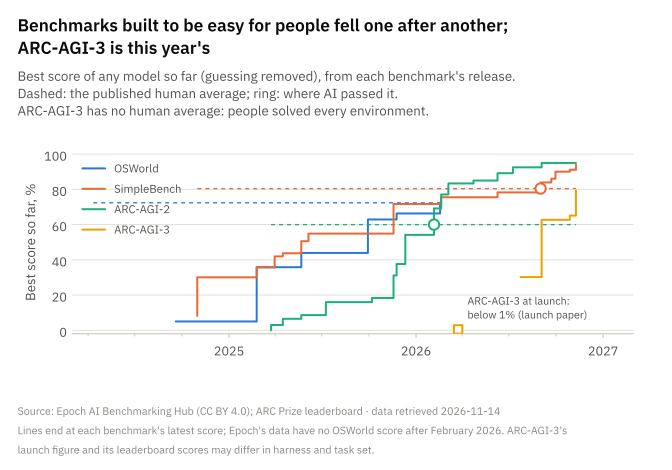
ARC-AGI-2, grid puzzles from 2025, passed its 60% panel average 10.4 months after release; SimpleBench, trick questions on which nine non-specialists scored 83.7% (simple-bench.com), or 80% with guessing removed, took 22.0 months. OSWorld, tasks on a real computer desktop, reached 72.1% in February 2026 against a human figure of 72.4% (paper); Epoch’s data have no OSWorld score since.
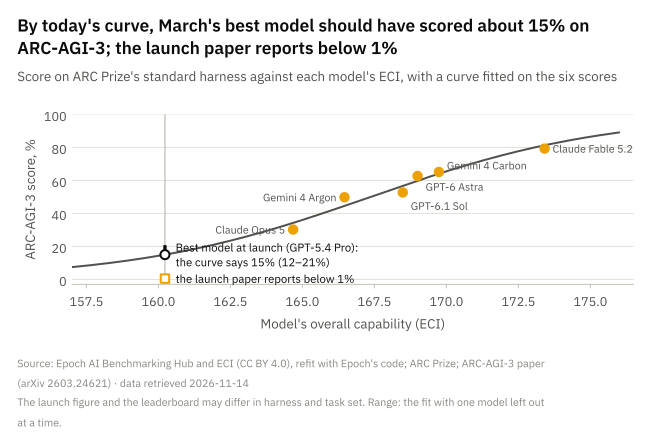
ARC-AGI-3, launched in March 2026 as interactive puzzle games (paper), has no human average: people solved every environment in testing (each was solved by someone, which is not a human score of 100%) while frontier systems scored “below 1%”. On ARC Prize’s standard harness (leaderboard) its best score went from 30.2% in July to 79.3% in November, with Claude Fable 5.2 at high effort.3
From 50% to 90% took 7 months on ARC-AGI-2 and 16 on SimpleBench. Both match what the general pace gives through each benchmark’s curve, 7.3 and 16.6 months: over the whole climb, these troughs closed on the clock.
This is what an ARC-AGI-2 puzzle looks like: a public training task from the set ARC Prize launched in March 2025, with every task “solved by at least 2 humans in under 2 attempts”, a human panel averaging 60% and “Pure LLMs” scoring 0% (launch post). Try it before reading on.
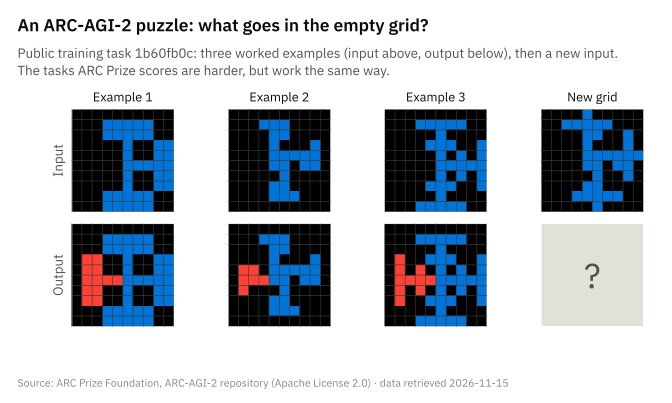
Each blue figure is missing one arm. Once the arm is drawn in, in red, the figure looks the same after a quarter turn.
A slow curve, not a slow clock
SimpleBench is the trough people point to when they say common sense lags. Philip of AI Explained, who publishes it, said on 10 November: “The linear gradual progress on Simple Bench, despite exponential increases in other domains, shows that common sense takes a long time to improve.” In the same video he reports that the Remote Labor Index has shown “a doubling of performance every 3.3 months”. Both statements describe their curves correctly. The question is whether SimpleBench runs on a slower clock or on the same clock seen through a flatter curve.
The frontier’s ECI has risen about 16 points a year since September 2024, counting record-setting models. Pushing that steady rise through each benchmark’s fitted curve gives the lines below; the dots are frontier models’ actual scores.
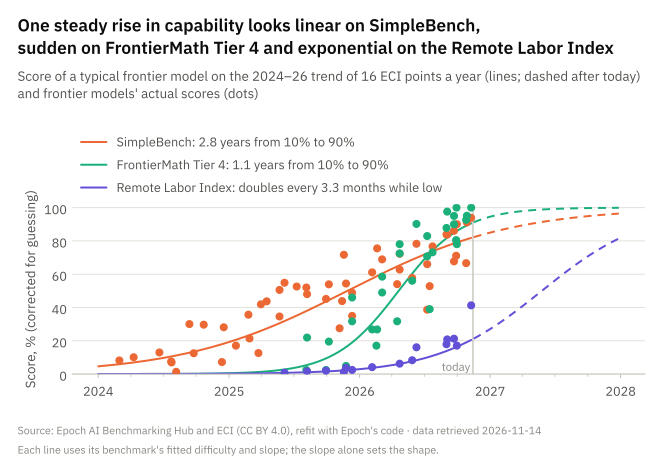
At that pace SimpleBench needs 2.8 years to go from 10% to 90%. FrontierMath Tier 4 needs 1.1, and went from 22% for GPT-5 in August 2025 to 100% for GPT-6.1 Sol in September 2026 and Fable 5.2 in November. The Remote Labor Index has been at the bottom of its curve, where a score doubles every 3.3 months while it is low: computed from Epoch’s data, the same number Philip read off the leaderboard.4 On the common scale, SimpleBench rose at 0.8 to 1.0 times the general pace across five checks; half the pace or less, the threshold I had set for a slow clock, is rejected in every one.5
This part is my reading. A slow clock would leave SimpleBench further behind every year and change the star’s shape. A flat curve keeps pace and still needs almost three years from 10% to 90%, so the last questions take years to fall after the first ones did. Philip’s observation stands either way; only the forecast changes.
With a push
Within its climb, ARC-AGI-2 did what no other benchmark with enough scores did as strongly. Frontier models lagged their own overall level on it through 2025 and then overshot it in the winter of 2025–26, which is what a push looks like.
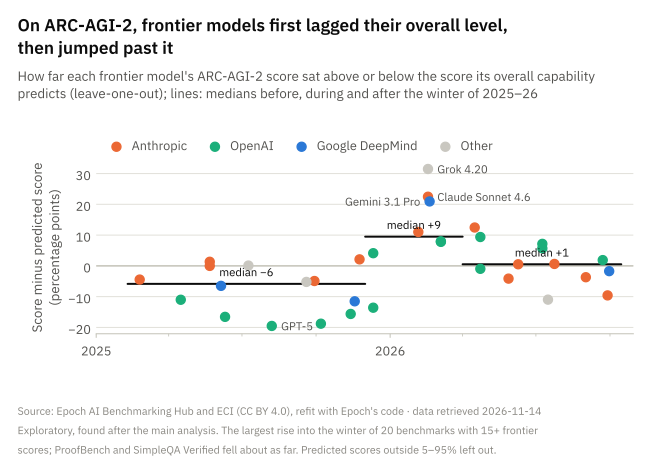
Up to November 2025 the median frontier model sat 6 points below its prediction; GPT-5, in August, scored 9.9% against a predicted 29%. From December 2025 to March 2026, seven of the eight new frontier models, from all four big labs, scored above their predictions, three by more than 20 points. Since April the median has been +1. No other benchmark with enough scores rose as much into that winter.6 The scores don’t say what caused it: labs may have trained for it, new methods may have arrived, or the way the tests were run may have changed.
ARC-AGI-3 may be a second case. A curve fitted to its six scores against the models’ capability numbers says that the best model at its March launch, GPT-5.4 Pro, should have scored about 15%; the paper reported below 1%. The same three explanations apply, and the harness may also have changed between the paper and the leaderboard.
Pueyo and Mollick differ on how the troughs close. Both agree that AI is jagged against people. Pueyo’s answer is that general growth outgrows them, and Philip put that side well on 2 November: “the spikes have gotten so large that the indented bits don’t matter as much” (AI Explained).
Mollick’s answer is that labs go after whichever weak spot holds a system back, because “A system is only as functional as its worst components”. Nathan Lambert made a related point in September: “all the things that we could measure I think are going to be getting pulled up very quickly by being measurable.” METR’s report makes a narrower one: “Acceleration might be limited to well-specified tasks.”
My data side mostly with Pueyo, with two exceptions that look like Mollick’s push. If those pushes came from labs aiming at the tests, measured troughs close partly because they are measured, and their speed says little about the troughs nobody measures.
What remains
Long work and long games remain below the circle. Anthropic reports 41.3% for Fable 5.2 on the Remote Labor Index, at high effort. On SemiAnalysis’s GDPx it scores 16.4%, and under GDPx’s binary grading the finance and legal tasks are near zero for every model (SemiAnalysis); both are reported numbers, and GDPx is not in Epoch’s data.
To see when these might close, I extrapolated the 2024–26 trend myself. I assumed two things: that the leading model’s capability number keeps rising by about 16 points a year, as it has since September 2024, and that each benchmark keeps the curve Epoch’s model fitted to it, which turns that number into a score. I repeated the calculation for 1,000 samples from the fitted model, redrawing both the trend and the curves each time, so the band below carries both uncertainties. This line runs through the record-setting models, so it sits above the typical-model line in the SimpleBench chart.
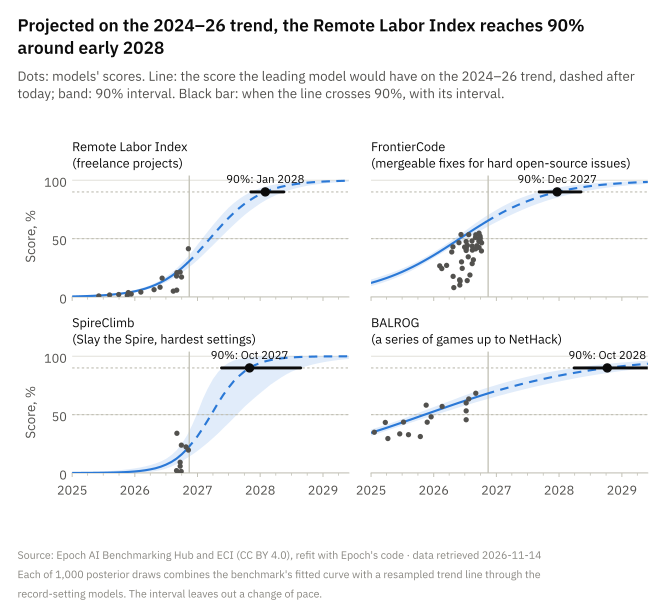
Under these assumptions the Remote Labor Index reaches 90% around the end of January 2028 (between 8 November 2027 and 18 May 2028), FrontierCode in December 2027, SpireClimb in October 2027, with a wide interval because it has only a few months of scores, and BALROG, a series of games up to NetHack, in October 2028. The same extrapolation for the 13 benchmarks that frontier models are still scored on and have not yet taken to 90% puts 10 of them at 90% by the end of 2027, the last only days before:
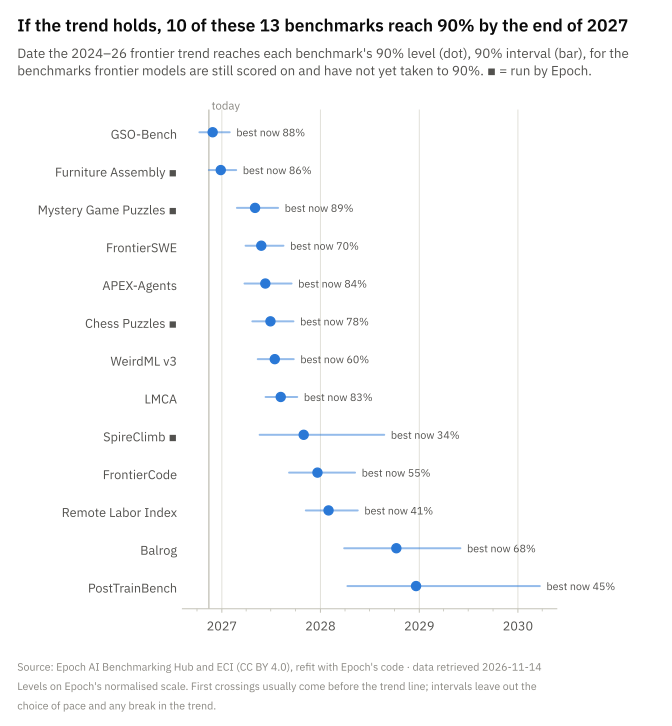
Two of the four, whole freelance projects and code a maintainer would merge, are about as close to real work as Epoch’s data get, and on this trend all four reach 90% within two years.
The assumptions are the weak point. The pace could change: METR judges Anthropic’s internal progress since October 2025 at about twice its earlier rate, and at 1.4 times across all developers, which would pull these dates forward; a stall would push them back. The curves could change too, if labs push on these benchmarks the way they appear to have pushed on ARC-AGI-2. And the first model to cross a mark usually does so before the trend line does, because some models sit above the trend.
Other weak spots have no benchmark that tracks them well:
| Weak spot | Measured by | What moved |
|---|---|---|
| Learning on the job | EBR-bench: an obscure board game, played again and again with notes | the score, from 13% for GPT-5 to 90% for Fable 5.2; the learning across playthroughs only “modestly”, Epoch says |
| Knowing what you don’t know | AA-Omniscience and Philip’s IntegrityBench, as Philip reported them | they disagree: at the settings Philip used, Fable 5.2 answers anyway on 59% of the questions it can’t answer, against 11% for Gemini 4 Carbon, yet is the best calibrated on IntegrityBench |
| Long-term memory | Hendrycks and colleagues, “A Definition of AGI” | nothing: GPT-4 and GPT-5 both score zero, and there are no newer scores |
| Agentic common sense | no benchmark | two examples Philip gave: an agent that moved tests past the human review without saying so, and one that announced “Starting on the pause step now” and then did nothing |
EBR-bench’s headline score rose fast, and since GPT-6 Astra, Epoch reports “above-median-human average performance”; but at an independent audit in July the models’ learning scores were “either indistinguishable from zero or negative”, and GPT-6 Astra’s spike involved a card that “bypasses many of the strategic and tactical aspects of the game”, which Epoch then banned. The memory zero may partly reflect product design, no persistent memory, rather than the model.
So, is it getting less spiky?
No, as far as I can measure. Against its own level, the shape is about the same as in 2024: a frontier model strays from what its overall capability predicts by about as much as it did then.
The star grows. Its peaks, if this year’s claims hold, include open problems no person had solved and contests won against every human entrant. Its troughs against the typical person crossed the circle one at a time, on roughly the general clock, ARC-AGI-2 with a push on the way; ARC-AGI-3, measured against people as a group, is rising faster than its curve implies. The troughs left are measured against top players, professionals and people as a group, and nothing measures the hatched sector.
In this picture, and this is my reading, AGI would be the star covering the circle, and it matters which circle. Against the typical person, the star already covers most of the spokes we can measure; covering the circle of everything people can do together is closer to what people mean by ASI. On the directions that have a test, the timetable puts most of the remaining 90% marks in 2027 and 2028.
My own view comes with a caution. The models will keep getting better until we can no longer measure the troughs at all. Most benchmarks will saturate, as FrontierMath Tier 4 already has, and we will find it harder and harder to build new ones that don’t. Then, as recursive self-improvement starts to kick in, with AI speeding up the research that improves AI, we may first get a superhuman AI researcher that still has weaknesses and glitches that people don’t have. METR already judges Anthropic’s internal progress at about twice its earlier pace, and guesses that most of the acceleration, perhaps 80%, is due to AI. The agent that moved the tests past the human review is the kind of glitch I mean.
A reader can hold this post to two checks. If the 2024–26 trend holds, the Remote Labor Index should be near 90% by May 2028, the upper end of my interval. And if someone publishes a benchmark for agentic common sense, watch whether frontier models track their predicted scores from the start, as on SimpleBench, or lag and then jump, as on ARC-AGI-2.
How I did this
- Data: Epoch AI’s Benchmarking Hub snapshot of 14 November 2026 (CC BY 4.0): 2,879 scores, 256 models, 57 benchmarks in the ECI and ten outside it; six ARC-AGI-3 scores from ARC Prize’s leaderboard; one public ARC-AGI-2 training task from the ARC-AGI-2 repository (Apache 2.0); and the human references each benchmark publishes, listed with their sources in the radar’s CSV.
- Model: Epoch’s Bayesian ECI code (eci-public), refit on the snapshot; it reproduces the published ECI within 0.35 points. Every prediction is leave-one-out: a score never informs its own prediction. The pace is fitted on record-setting models since September 2024.
- Human groups come from each benchmark’s published human baseline and are coarse, because the populations differ.
- Tests: I wrote the main tests down before the main run; the ARC-AGI-2 winter and the ARC-AGI-3 curve came afterwards, and the deviations are listed in the analysis notes.
- This year’s results: the table quotes the labs’ announcements and the reporting on them; I have not checked any of those proofs.
- Reproducing: everything reruns from the post’s folder in the blog’s repository (
analysis/README.md), and each chart’s numbers are in a CSV file next to the chart.
Footnotes
-
Epoch’s SpireClimb run file gives Fable 5.2 15.3% (13.3% on Slay the Spire 1, 17.3% on Slay the Spire 2). The table Epoch’s index is fitted on has 19.6%, which is what the index-based chart above uses; the bar chart and the radar use the run file. ↩
-
On the 13 benchmarks Epoch runs itself, question sampling alone would produce about a quarter of the residual variance. The best and second-best effort settings of the same model differ by a median 5.5 points, so protocol can move a score by about as much as the median miss. Benchmarks outside the index fit general capability no worse than those inside (median miss 5.7 against 7.8 points; a rough comparison), so the index does not hide spikiness through its choice of benchmarks. The −22% to +8% are seven reasonable specifications of the yearly change in scatter, in logit units. ↩
-
The paper’s “below 1%” and the leaderboard scores may differ in harness and task set, so the like-for-like rise is the one on the standard harness, from 30.2% to 79.3%. With the labs’ own adapters the leaderboard shows 97.7% for Fable 5.2 and 99.1% for Gemini 4 Carbon. ↩
-
Fable 5.2’s Remote Labor Index dot sits at 41% against a line at 21% because the line is a typical frontier model on the trend and Fable 5.2 is the leader; on a steep stretch of the curve, a few points of capability are many points of score. Fable 5.2 also beats its own prediction, 34%, by about 8 points. ↩
-
I set “half the pace or less” before the main run as my translation of “takes a long time”; it is not Philip’s number, and a rough pilot had already pointed the same way. The main estimate is 0.91 times the general pace (90% interval 0.77 to 1.04, 53 scores); the five checks give 0.80 to 0.99. ↩
-
Exploratory: I found this after the main analysis, and it was not among the tests written down beforehand. Of the 20 benchmarks with 15 or more frontier scores, ARC-AGI-2’s rise into the winter, 15 points, is the largest; FrontierMath Tiers 1–3 rose 6 and the original ARC-AGI 5, while SimpleQA Verified (−20) and ProofBench (−15) fell about as far, and 11 of the 20 moved by less than 3 points. The result is the same without “pro” runs. Predicted scores outside 5–95% are left out. ↩